Need Zoho information or help due to COVID-19? Let us know.

Tag : zoho analytics

ZBrains Omnichannel Personalization

Zoho Analytics: Customize Marketing for Omnichannel Personalization

Zoho Analytics is a powerful tool for businesses looking to achieve omnichannel personalization in their marketing strategies. As a cloud-based business intelligence and analytics solution, companies can easily create insightful reports, dashboards, and visualizations. 

With features such as pre-built connectors, dynamic dashboards, and more, Zoho Analytics aids marketers in making better decisions on how to allocate resources for optimizing campaigns across multiple channels. Here, we’ll take a look at how to put it to good use by building an omnichannel marketing dashboard based on best practices we’ve observed working with ZBrains’ clients.

How does Zoho Analytics enable Omnichannel Personalization?

Zoho Analytics offers an easy-to-use, drag-and-drop builder that allows marketers to create custom dashboards with powerful visualizations, enabling omnichannel personalization. The platform includes several features that make it an ideal tool for creating an omnichannel marketing dashboard, including:

  • Pre-built connectors to quickly and easily connect data from multiple sources
  • Dynamic dashboards and drill-down reports, enabling marketers to slice and dice their data in real-time
  • Role-based access control, allowing organizations to manage who can access and edit dashboards
  • Automated data refresh, making it easy to maintain up-to-date reports
  • Advanced analytics with powerful AI capabilities for predicting future trends

However, Zoho can’t do it all on its own. For example, data from external sources must be connected to the platform before it can be used in dashboards. For this reason, it’s essential to understand the data sources available and how to connect them to Zoho.

How to Connect Data Sources for Omnichannel Personalization Using Zoho Analytics

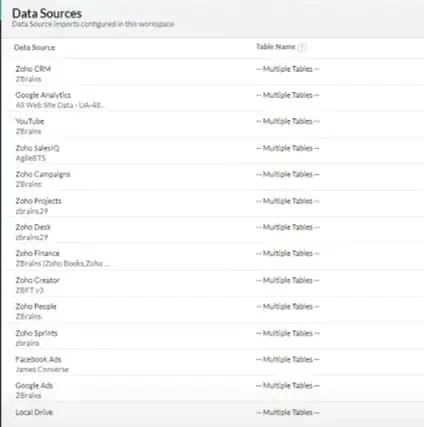
Zoho Analytics provides a wide range of pre-built connectors that allow marketers to quickly and easily connect data from multiple sources.

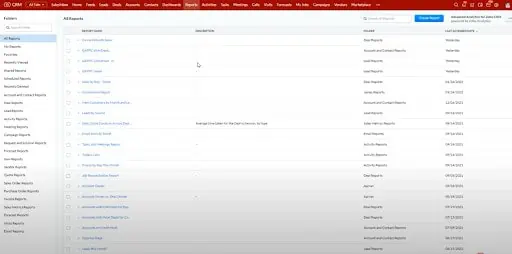
To start, log in to your Zoho account and click the ‘Data Sources tab. Here, you’ll find a list of all the supported data sources and instructions on how to connect them.

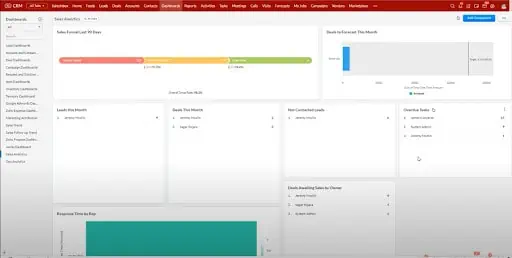
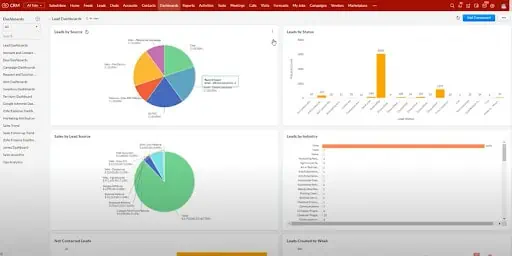
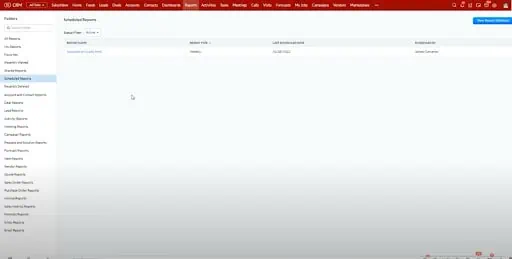
Once the data sources are connected, you can begin creating your dashboard. Zoho Analytics provides several drag-and-drop options allowing marketers to create custom dashboards quickly. You can also use templates and widgets to customize the dashboard further.

Pulling Data From Multiple Sources With Zoho

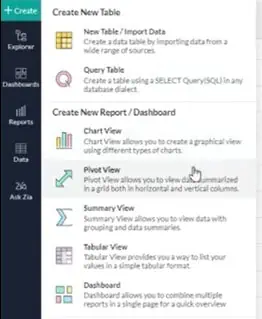
Once your sources are connected, the next step is to combine data from multiple sources within your dashboard. 

To do this, select the data sources from which you want to pull data and then drag and drop them into the dashboard. You can customize the visuals using widgets, charts, and other elements.

Metrics to Track Using Omnichannel Personalization Reporting

Depending on your omnichannel strategy, there are several different metrics you may want to track in your dashboard.

SEO and Website Metrics

Key metrics to track:

  • Organic Traffic
  • Bounce Rate
  • Conversion Rate
  • Conversion Volume
  • Time on Site

You may also want to use Zoho Analytics to track the SEO performance of your content and campaigns (i.e., keywords, topic authority, backlinks, etc.), as this will help you understand how well your content is performing in terms of search engine rankings.

Social Media Metrics

Key metrics to track:

  • Total Dollars Spent (by campaign)
  • Number of Leads
  • Percent Junk (i.e., spam)
  • Cost per Click (CPC) (by campaign)
  • Cost per Lead (by campaign)
  • Revenue Generated (by campaign)
  • Return on ad spend (RoAS)

To get a complete picture of social media performance, you should monitor qualitative metrics like sentiment and user engagement. These metrics can be a little harder to measure but can provide valuable insights into the success of your campaigns.

SEM Metrics

Since many SEM activities are paid, they share some overlap with the metrics tracked for paid social media campaigns. The essential KPIs include:

  • Cost per Click (CPC)
  • Total Dollars Spent
  • Revenue Generated
  • Return on Ad Spend (RoAS)

Zoho Analytics can also help you monitor the cost and quality of the clicks you get for omnichannel personalization. This includes metrics like ad relevancy, click-through rate (CTR), impression rate, and keyword relevance. You can also compare your ad metrics against your SEO and web conversion metrics to determine whether or not your ads are worth the money.

Traditional Media

Finally, traditional media includes channels like television, radio, print, and out-of-home (OOH) advertising. Businesses can track metrics like budget spent, impressions, reach, and audience engagement in their dashboard.

Mostly traditional media outlets are mainly used for PR campaigns. These KPIs measure brand awareness and reach, ad recall, cost-effectiveness, and overall ROI.

Tips for a Successful Implementation and Choosing What to Track

Here are a few tips to ensure you get started on the right track with your new omnichannel dashboard:

  1. Start by mapping out your objectives. Could you identify the KPIs you want to track and ensure they align with your business and marketing goals?
  2. Choose data sources wisely. You can select only the seeds that will give you the most valuable insights into your marketing efforts.
  3. Use the proper connectors and integrations. Depending on the platform you are using for your dashboard, you may need to configure special connectors or integrations to pull data.
  4. Identify key performance indicators for each channel. Each channel should have its own set of KPIs, so could you make sure to track the right metrics?
  5. Create a dashboard that is user-friendly and informative. Could you ensure the dashboard is easy to navigate, understand, and use?
  6. Automate where possible. Automation can save you time and ensure the accuracy of your data.
  7. Avoid tracking too many KPIs. Too many metrics mean more work, so focus on the most critical KPIs for your business.

Some of the most commonly used Analytics connectors include Facebook Ads, Facebook Custom Audiences, Google Ads, Google Analytics, and LinkedIn Ads. Specific integrations you might want to consider having: 

  • VoIP: Integrating with VoIP services can help you track phone calls and conversations, mainly if your organization uses a service like RingCentral or Aircall.
  • Integrations with ESPs: Integrating with email marketing service providers (ESPs) like MailChimp, Constant Contact, and SendinBlue will allow you to track the performance of your email campaigns (if you aren’t managing your email marketing within Zoho).
  • Callrail: This call-tracking software helps you analyze the performance of your calls and conversations.
  • Clearbit: Integrating Zoho with Clearbit can help you get enriched data about your customers, such as job titles and social profiles.
  • ZoomInfo: This contact database aggregates publicly available data on businesses and people. Integrating with ZoomInfo can help you get insights into your target market.

Lastly, omnichannel personalization using Zoho Analytics is a way to boost customer satisfaction and drive sales.

We understand that setting up an omnichannel marketing dashboard in Zoho Analytics can be daunting. That’s why ZBrains is here to help. Our experienced professionals can guide you through the entire process, from data integration and customization to dashboard creation and optimization.

With ZBrains expertise, you can better understand your customer’s behavior and preferences and use that knowledge to deliver personalized experiences that drive engagement and loyalty. Please get in touch with us today to learn more about how we can help you achieve your marketing goals with Zoho Analytics.

ZBrains Zoho Dashboards for Sales

Building Zoho Dashboards for Sales: Your Ultimate Guide by ZBrains

Zoho CRM is a user-friendly and robust customer relationship management software suitable for businesses of any scale. It helps companies effectively manage customer interactions, automate sales processes, and monitor performance. With the help of Zoho dashboards, businesses can quickly get insights into their sales pipeline, identify bottlenecks, and make data-driven decisions to improve their sales performance. 

But one of the best features of Zoho CRM is its ability to create powerful, visually appealing sales dashboards. A well-designed dashboard can help you get an accurate picture of your business’s performance at a glance. With the right data, your dashboards can identify key trends, highlight opportunities, and help you make informed decisions.

Optimizing Sales Performance with Zoho CRM and Analytics

Zoho CRM simplifies sales, marketing, and customer service by utilizing a unified data source for all activities. This approach enables businesses to easily track essential metrics such as sales volume, order fulfillment rate, and revenue per customer. With the help of Zoho dashboards, businesses can efficiently monitor the performance of individual employees or teams by comparing their metrics against those of others within the organization. This valuable information empowers businesses to make data-driven decisions and optimize their sales process for better results.

Zoho Analytics, on the other hand, can use multiple data sources from across the organization to provide an even more comprehensive view of your sales performance. For example, you can track customer lifetime value (CLV) and customer acquisition cost (CAC), as well as average order size, frequency of purchase, and other metrics. Users can also embed these into the Zoho CRM homepage to quickly overview their business performance in real-time.

Zoho CRM provides a variety of views tailored to meet the needs of individual sales reps, managers, and executives. These views offer insights into essential key performance indicators (KPIs) that businesses should monitor. With the help of Zoho dashboards, businesses can effortlessly keep track of these KPIs, optimize their sales process, and maximize their revenue. Let’s explore the specific KPIs you should monitor for each role within your organization.

Individual Sales Reps

To effectively monitor individual sales reps responsible for identifying prospects, closing deals, and driving growth, track their performance on specific metrics such as:

  • Number of Leads: The number of leads created or assigned in a given time frame.
  • Number of Meetings: The total number of meetings booked with new prospects.
  • Number of Meetings Completed: The number of scheduled meetings that successfully occurred.
  • Show Rate: The number of meetings that were attended vs. the number of meetings that were scheduled.
  • Opportunities Created: The number of opportunities created in a given time frame.
  • Lead Conversion Rate: The percentage of total leads that have been converted into customers.
  • Total Pipeline Value: The total dollar value of all opportunities in the sales pipeline.
  • Total Pipeline Growth: The change in the pipeline value over time.
  • Total Deals Closed: The number of deals closed in a given time frame.
  • Dollar Amount Closed: The total dollar amount of all deals closed in a given time frame.
  • Win Rate: The percentage of total deals that are closed successfully.
  • Lead-to-Win Rate: The number of leads it takes to close a deal.
  • Leads/Opportunities/Accounts With Activity: The number of leads that have had activity (calls, emails, meetings) in a given time frame.
  • Activity Levels: The average number of activities performed by each sales rep (on an individual activity basis) in a given time frame.

Sales Managers

Sales managers should be responsible for the sales metrics of the team, as they oversee the sales team and ensure each rep achieves their goals.

  • Rep Metrics: Sales rep performance data such as lead conversion rate, win rate, and dollar amount closed.
  • Team Metrics: Team-level performance data such as total pipeline value, average deal size, and overall close rate.
  • Cohort Analysis: The ability to compare sales performance among different groups of reps (e.g., by location or product
  • Metrics by Geography/Territory: The total number of deals, pipeline value, and revenue based on geographic region.
  • Metrics by Product: The total number of deals, pipeline value, and revenue based on the product or service being sold.
  • Metrics by Lead Source: The total number of deals, pipeline value, and revenue based on the lead source.
  • Revenue by Person: The total dollar amount closed by each sales rep in a given time frame.
  • Forecasted Revenue: The estimated revenue to be earned in the next quarter or year, based on pipeline value and rep metrics.

Executive Leadership

Executives can use Zoho dashboards to ensure the company is on track to reach its goals, and that all departments are working together efficiently.

  • Lead-to-Win Rate: The rate at which leads are converted into customers shows executives how efficient the sales process is.
  • Pipeline Value: The total dollar value of all opportunities in the sales pipeline helps executives track progress toward their goals.
  • Net New Customers: The number of new customers acquired in a given time frame.
  • Revenue Trends: Year-over-year revenue trends show executives if the company is on track to meet its goals.
  • Customer Lifetime Value (CLV): The total value of all transactions with existing customers helps executives understand customer loyalty and profitability.
  • Customer Acquisition Cost (CAC): The cost of acquiring each new customer is a critical metric that shows executives how efficient their sales process is.
  • Churn Rate: The rate at which customers are lost can indicate customer satisfaction and potential areas of improvement.
  • Sales Efficiency: The overall efficiency of the sales team demonstrates how much time and effort is being spent on each sale.

How to Build an Effective Sales Dashboard in Zoho CRM

Whatever metrics you intend to track, here are a few of our top suggestions for monitoring them within your Zoho CRM sales dashboard.

  1. Choose two critical metrics for each role in your organization. Assign each person a leading KPI and a trailing KPI based on importance
  2. Make sure your system can easily gather the necessary data for the KPIs by setting up automation, automating your reporting, or defining custom fields. You can accomplish this by establishing automation, automating your reporting, or defining custom fields.
  3. Create a weekly version of each KPI, grouped by person, and also for the entire company/department. This will help you get a better understanding of each person’s performance and let you easily compare it with the team as a whole.
  4. Make sure to verify the data and the report’s accuracy, especially if you plan to tie them to performance reports or incentives. 
  5. Add a trend (and perhaps a forecast), if you have enough data to do so.
  6. Hold a weekly-to-daily meeting to review the KPIs. Hold people responsible for their performance by having a discussion and tracking progress over time.
  7. Set quotas and targets for each KPI. Target is generally 20% above quota, and quota is the desired outcome for each metric.
  8. Create a contest or incentives around your target(s) to motivate your team.

Finally, try not to change the KPIs too much, or too quickly, unless everyone agrees that doing so is appropriate. Determining the “right” KPIs and optimal quota for your organization might take some time, but it’s still best to be as consistent as possible.

Need help creating your ideal Zoho sales dashboard? ZBrains’ expert team is standing by for any sales tracking or measurement questions you may have. Reach out today for more information.

ZBrains Zoho CRM Reports Graph

Maximize Sales with Zoho CRM Reports: Analytics Reporting Guide

Of all the advantages of using Zoho, one of the most compelling is the platform’s simple, yet in-depth reporting applications. 

Depending on what you need to report on, you may find that the basic reporting options built into Zoho CRM suffice. Alternatively (or, additionally), you can tap into the power of the more advanced Zoho Analytics when you need to get a deeper understanding of how your business functions.

With that in mind, let us explore each in turn, looking more closely at the advantages and disadvantages of Zoho CRM or Zoho Analytics. 

Zoho CRM

As a CRM, Zoho’s offering is well-rounded and user-friendly, offering most businesses everything they need to keep track of customer relationships. 

From a reporting perspective, Zoho CRM comes with its own reporting engine that is customizable and operates in real-time. As a result, the program enables you to run reports on key relationship and sales metrics, as well as email them out on a scheduled basis. Zoho CRM also comes pre-built with a myriad of reports useful for sales, account management, and front office leadership.

Building Your Dashboards

In the Zoho CRM reporting window, you will see a list of records that you can build into tables, including pivot tables and pivot charts:

You can choose a range of components to group into your dashboards, as well as place components on your home screen. 

An example of a group of components

An example of a dashboard

That said, while Zoho CRM allows you to choose the time or table that best represents your data, it does not allow you to change how your query is built. When you choose the type of table you want to use, Zoho writes the query for you. 

Scheduling Your Reports

With Zoho CRM, you can schedule reports to be automatically sent out by email, which can streamline internal progress reporting and status updates. 

Simply go to the left-hand menu, pick Scheduled Reports, and enter the report you want to have emailed out on a regular basis. 

The major advantage Zoho CRM reporting is real-time but limited to CRM data with no drill-down configuration. If you need additional reporting capabilities beyond what Zoho CRM can provide, you may want to look into Zoho Analytics.

Zoho Analytics

Zoho Analytics is Zoho’s business intelligence and analytics platform. Zoho Analytics allows you to review and report on data from a variety of data sources, as well as customize how that data is presented and shared. 

Data Sources

Incorporating data from multiple sources means that Zoho Analytics facilitates a much deeper dive into your data. In addition to Zoho data points, you can also use Analytics to pull in data from external applications, such as Google Analytics, YouTube, Google Ads, or Facebook. 

Within Analytics, simply select your chosen data sources, and pull them into the same workspace. From there, you will be able to query those different tables together to build reports that span across each application. 

Customizing Your Data Drill-Downs

Like Zoho CRM, Analytics allows you to choose from a variety of charts to present your data. However, with Zoho Analytics, you also have the option to customize charts and tables for tailored insights with Zoho Analytics.

Once you have built your table or chart, you can drag and drop them onto your dashboard for enhanced visibility. 

You can also utilize global filters–such as user, team, and date–to drill down into your data. For example, if you wanted to check on an individual team’s performance, you could filter your reports by team. All of the charts and tables that include a team filter would then be updated and displayed accordingly. 

Trend Reporting

One final feature that may make Zoho Analytics a better fit for your organization is its predictive capabilities. Analytics displays trends and projections, enabling informed predictions for future business decisions and investments.  

As a note, this is not an ‘either/or’ situation. You can Embed Zoho Analytics reports into Zoho CRM via the Analytics widget, by inputting the dashboard URL. Overall, Zoho Analytics is valuable for teams needing trend reporting, global filtering, and multiple data sources.

It is worth keeping in mind, however, that Analytics is not a real-time dashboard. The tradeoff for this enhanced functionality is that you will have a three-hour sync to contend with, though this is not likely to be a deal-breaker for most teams.

Zoho CRM vs. Zoho Analytics Reporting

As you explore your different Zoho reporting options, weigh your options within CRM and Analytics carefully. Taking these and other key points into consideration will help you arrive at the right solution for your team.

Any other questions about Zoho CRM and Zoho Analytics? Reach out to the team at ZBrains if you have any queries or need clarification.